

What I Do
I build high-performance data systems that transform hours of manual reporting into seconds of strategic insight. By implementing a "Drop-and-Refresh" architecture, I ensure your Amazon data is always analysis-ready. You stop wrestling with formatting and start executing on the KPIs that move the needle.
My custom setups allow you to bypass the spreadsheet grind: simply upload your reports and watch your dashboard update instantly.
Workshop
Automated CSV Integration
Eliminate manual data entry with custom automated workflows. By linking your local folders directly to your reporting environment, your dashboards update instantly, transforming hours of "spreadsheet work" into seconds of "refreshing."

Data Synthesis & Cleanup
I Bridge the gap between your disparate data streams. I clean and consolidate complex Seller Central exports into a structured model, ensuring your advertising spend and inventory levels are always aligned with your actual sales.
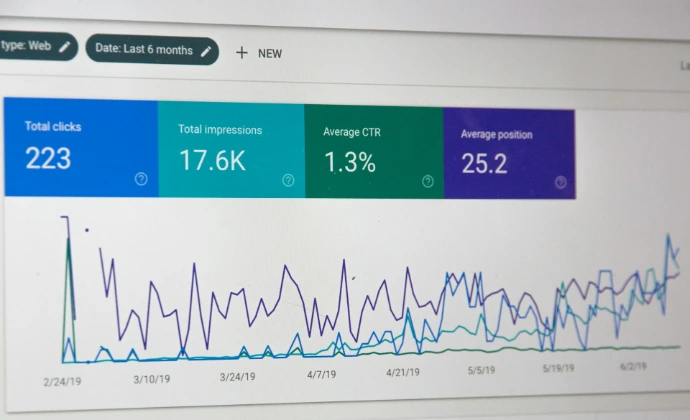
Visual KPI Tracking
Gain immediate clarity on your most critical metrics. I build custom tracking for MoM growth, SKU-level profitability, turning rows of raw data into a visual roadmap for your next big move.


Transforming Chaos into Clarity
#InsightsThatMatter
Experience the Data Architecture.